upepo
Elder Lister
Most country statistics, even from reputable agencies, can be grossly misleading if accepted at face value. Often, such statistics are collected using parameters that don't make much sense in the target population. For example, if a family owns a briefcase-sized solar panel with two bulbs in the homestead, that family is classified as having off-grid electricity. In practical sense, however, such a family cannot make much difference in their lives using the solar electricity. It is the reality that many statistics do not make sense when compared with the real situation on the ground. For example, look at the unemployment levels in the graph below adapted from the Kenya Bureau of Statistics.
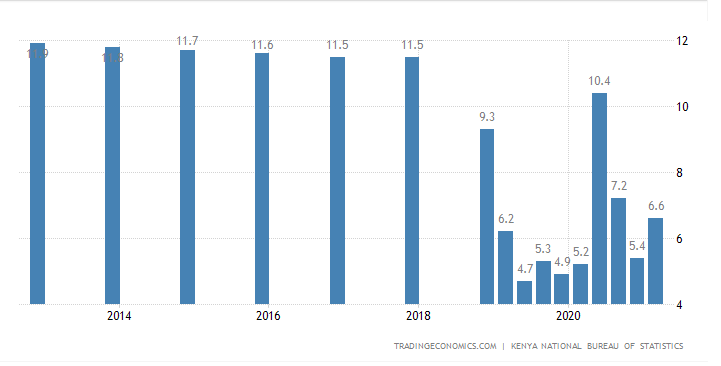
Why do these figures seem unrealistically low? The answer lies in the definition of unemployment; "In Kenya, the unemployment rate measures the number of people actively looking for a job as a percentage of the labour force." This means an unemployed individual who is not looking for a job is not considered unemployed.
How about the minimum wage? The graph below shows the minimum wages between 2012 and 2022.
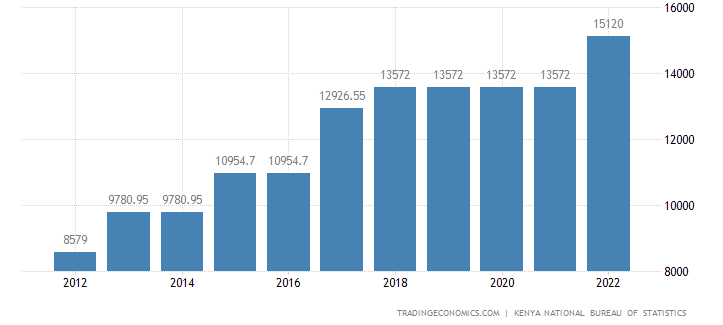
Again, these figures do not apply for the majority of the population. Lesson; you ought to exercise care when quoting figures from the Kenya Bureau of Statistics. There is always space for moderation.
Kenya Unemployment Rate
Why do these figures seem unrealistically low? The answer lies in the definition of unemployment; "In Kenya, the unemployment rate measures the number of people actively looking for a job as a percentage of the labour force." This means an unemployed individual who is not looking for a job is not considered unemployed.
How about the minimum wage? The graph below shows the minimum wages between 2012 and 2022.
Kenya Minimum Wages
Again, these figures do not apply for the majority of the population. Lesson; you ought to exercise care when quoting figures from the Kenya Bureau of Statistics. There is always space for moderation.